G1GC tuning
Reduced heap size
For this test, the heap was simply reduced from 16GB, to 8GB for a period lasting approximately one day.
|
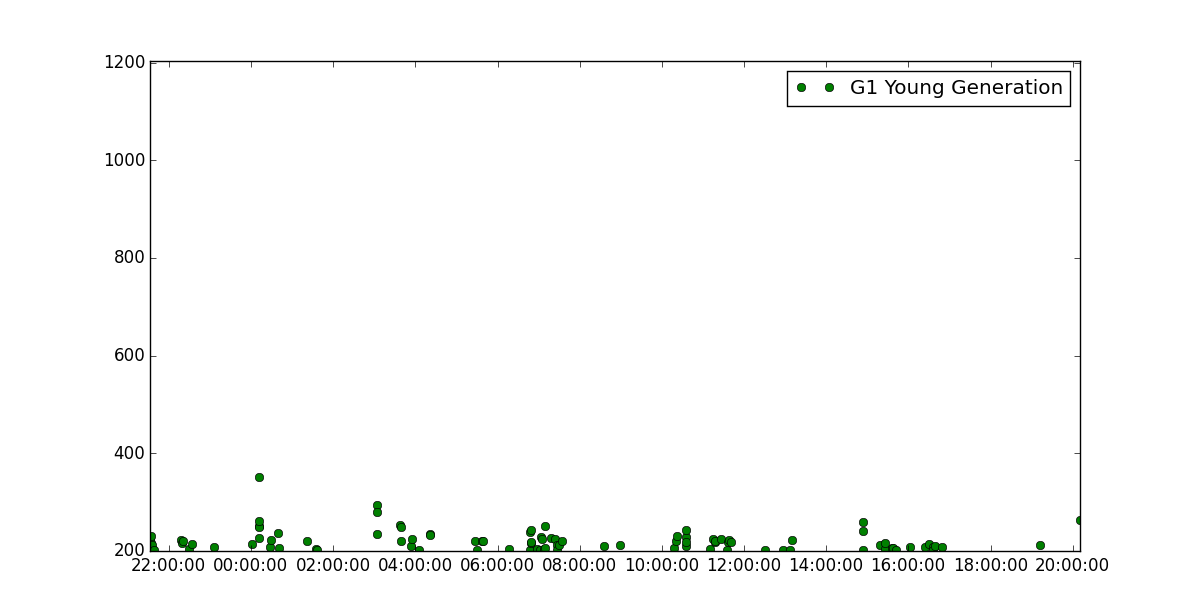
16GB heap (baseline)
|
8GB heap
|
|---|---|
| Cassandra read rate | |
| Cassandra write rate | |
| Cassandra read latency (75p) | |
| Cassandra read latency (99p) | |
| Cassandra write latency (75p) | |
| Cassandra write latency (99p) | |
| Cassandra connection timeouts/sec | |
| Collection time (accumulated, 5 minute moving average) | |
| Collections | |
 |
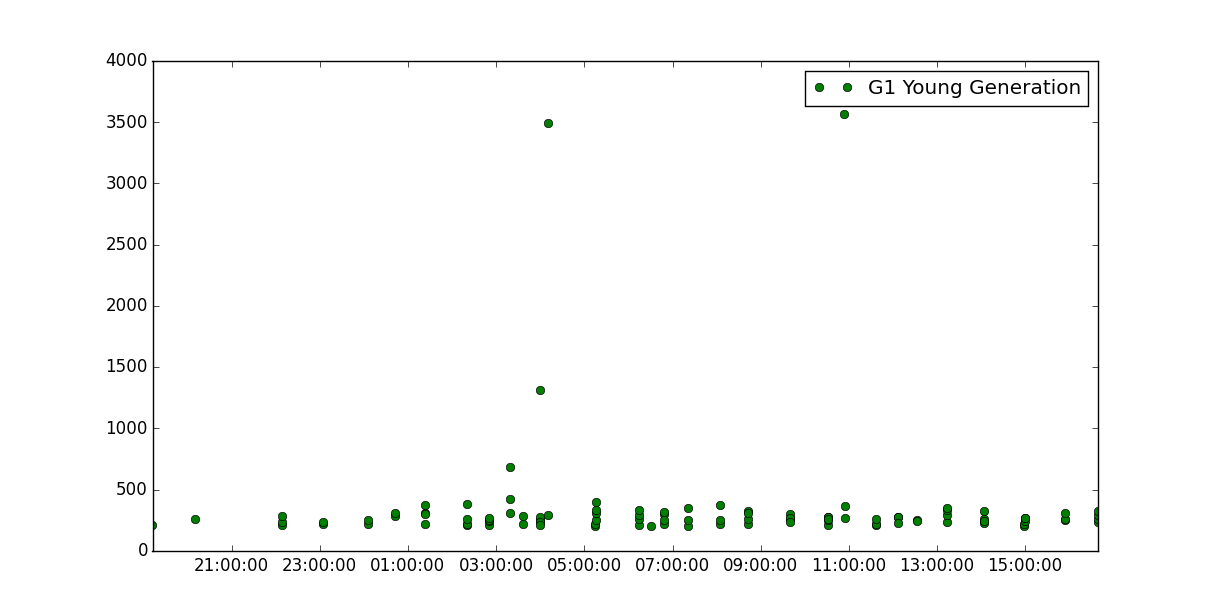 |
Observations
The most significant change is to collection time, with an average up more than 115ms from the baseline, with a significant percentage of collections exceding the soft realtime target of 300ms. There were 4 allocation failures that resulted in collection times of 686ms, 1.3s, 3.4s, and 3.5s respectively.
At an 8GB heap, regions are 4MB in size (they are 8MB with 16GB heaps). That means that any object more then 2MB in size will be allocated as humongous. During the course of this test there were 664 humongous allocations that triggered a concurrent cycle. 343 were 3000000 bytes or less, 58 over 4000000, 57 over 5000000, 36 over 6000000, and 2 over 7000000.