Example: Add logging and metrics to the PHP / Redis Guestbook example
This tutorial builds upon the PHP Guestbook with Redis tutorial. Lightweight log, metric, and network data open source shippers, or Beats, from Elastic are deployed in the same Kubernetes cluster as the guestbook. The Beats collect, parse, and index the data into Elasticsearch so that you can view and analyze the resulting operational information in Kibana. This example consists of the following components:
- A running instance of the PHP Guestbook with Redis tutorial
- Elasticsearch and Kibana
- Filebeat
- Metricbeat
- Packetbeat
- Objectives
- Before you begin
- Start up the PHP Guestbook with Redis
- Add a Cluster role binding
- Install kube-state-metrics
- Clone the Elastic examples GitHub repo
- Create a Kubernetes Secret
- Managed service
- Deploy the Beats
- View in Kibana
- Scale your deployments and see new pods being monitored
- View the changes in Kibana
- Cleaning up
- What's next
Objectives
- Start up the PHP Guestbook with Redis.
- Install kube-state-metrics.
- Create a Kubernetes secret.
- Deploy the Beats.
- View dashboards of your logs and metrics.
Before you begin
You need to have a Kubernetes cluster, and the kubectl command-line tool must be configured to communicate with your cluster. If you do not already have a cluster, you can create one by using Minikube, or you can use one of these Kubernetes playgrounds:
To check the version, enter kubectl version.
Additionally you need:
A running deployment of the PHP Guestbook with Redis tutorial.
A running Elasticsearch and Kibana deployment. You can use Elasticsearch Service in Elastic Cloud, run the download files on your workstation or servers, or the Elastic Helm Charts.
Start up the PHP Guestbook with Redis
This tutorial builds on the PHP Guestbook with Redis tutorial. If you have the guestbook application running, then you can monitor that. If you do not have it running then follow the instructions to deploy the guestbook and do not perform the Cleanup steps. Come back to this page when you have the guestbook running.
Add a Cluster role binding
Create a cluster level role binding so that you can deploy kube-state-metrics and the Beats at the cluster level (in kube-system).
kubectl create clusterrolebinding cluster-admin-binding \
 --clusterrole=cluster-admin --user=<your email associated with the k8s provider account>
Install kube-state-metrics
Kubernetes kube-state-metrics is a simple service that listens to the Kubernetes API server and generates metrics about the state of the objects. Metricbeat reports these metrics. Add kube-state-metrics to the Kubernetes cluster that the guestbook is running in.
Check to see if kube-state-metrics is running
kubectl get pods --namespace=kube-system | grep kube-stateInstall kube-state-metrics if needed
git clone https://github.com/kubernetes/kube-state-metrics.git kube-state-metrics
kubectl create -f examples/standard
kubectl get pods --namespace=kube-system | grep kube-state-metrics
Verify that kube-state-metrics is running and ready
kubectl get pods -n kube-system -l app.kubernetes.io/name=kube-state-metricsOutput:
NAME                                 READY   STATUS    RESTARTS   AGE
kube-state-metrics-89d656bf8-vdthm   2/2     Running     0          21s
Clone the Elastic examples GitHub repo
git clone https://github.com/elastic/examples.gitThe rest of the commands will reference files in the examples/beats-k8s-send-anywhere directory, so change dir there:
cd examples/beats-k8s-send-anywhereCreate a Kubernetes Secret
A Kubernetes SecretStores sensitive information, such as passwords, OAuth tokens, and ssh keys. is an object that contains a small amount of sensitive data such as a password, a token, or a key. Such information might otherwise be put in a Pod specification or in an image; putting it in a Secret object allows for more control over how it is used, and reduces the risk of accidental exposure.
Note: There are two sets of steps here, one for self managed Elasticsearch and Kibana (running on your servers or using the Elastic Helm Charts), and a second separate set for the managed service Elasticsearch Service in Elastic Cloud. Only create the secret for the type of Elasticsearch and Kibana system that you will use for this tutorial.
Self managed
Switch to the Managed service tab if you are connecting to Elasticsearch Service in Elastic Cloud.
Set the credentials
There are four files to edit to create a k8s secret when you are connecting to self managed Elasticsearch and Kibana (self managed is effectively anything other than the managed Elasticsearch Service in Elastic Cloud). The files are:
- ELASTICSEARCH_HOSTS
- ELASTICSEARCH_PASSWORD
- ELASTICSEARCH_USERNAME
- KIBANA_HOST
Set these with the information for your Elasticsearch cluster and your Kibana host. Here are some examples
ELASTICSEARCH_HOSTS
A nodeGroup from the Elastic Elasticsearch Helm Chart:
["http://elasticsearch-master.default.svc.cluster.local:9200"]A single Elasticsearch node running on a Mac where your Beats are running in Docker for Mac:
["http://host.docker.internal:9200"]Two Elasticsearch nodes running in VMs or on physical hardware:
["http://host1.example.com:9200", "http://host2.example.com:9200"]
Edit ELASTICSEARCH_HOSTS
vi ELASTICSEARCH_HOSTSELASTICSEARCH_PASSWORD
Just the password; no whitespace, quotes, or <>:
<yoursecretpassword>
Edit ELASTICSEARCH_PASSWORD
vi ELASTICSEARCH_PASSWORDELASTICSEARCH_USERNAME
Just the username; no whitespace, quotes, or <>:
<your ingest username for Elasticsearch>
Edit ELASTICSEARCH_USERNAME
vi ELASTICSEARCH_USERNAMEKIBANA_HOST
The Kibana instance from the Elastic Kibana Helm Chart. The subdomain
defaultrefers to the default namespace. If you have deployed the Helm Chart using a different namespace, then your subdomain will be different:"kibana-kibana.default.svc.cluster.local:5601"A Kibana instance running on a Mac where your Beats are running in Docker for Mac:
"host.docker.internal:5601"Two Elasticsearch nodes running in VMs or on physical hardware:
"host1.example.com:5601"
Edit KIBANA_HOST
vi KIBANA_HOSTCreate a Kubernetes secret
This command creates a secret in the Kubernetes system level namespace (kube-system) based on the files you just edited:
kubectl create secret generic dynamic-logging \
  --from-file=./ELASTICSEARCH_HOSTS \
  --from-file=./ELASTICSEARCH_PASSWORD \
  --from-file=./ELASTICSEARCH_USERNAME \
  --from-file=./KIBANA_HOST \
  --namespace=kube-system
Managed service
This tab is for Elasticsearch Service in Elastic Cloud only, if you have already created a secret for a self managed Elasticsearch and Kibana deployment, then continue with Deploy the Beats.
Set the credentials
There are two files to edit to create a k8s secret when you are connecting to the managed Elasticsearch Service in Elastic Cloud. The files are:
- ELASTIC_CLOUD_AUTH
- ELASTIC_CLOUD_ID
Set these with the information provided to you from the Elasticsearch Service console when you created the deployment. Here are some examples:
ELASTIC_CLOUD_ID
devk8s:ABC123def456ghi789jkl123mno456pqr789stu123vwx456yza789bcd012efg345hijj678klm901nop345zEwOTJjMTc5YWQ0YzQ5OThlN2U5MjAwYTg4NTIzZQ==ELASTIC_CLOUD_AUTH
Just the username, a colon (:), and the password, no whitespace or quotes:
elastic:VFxJJf9Tjwer90wnfTghsn8wEdit the required files:
vi ELASTIC_CLOUD_ID
vi ELASTIC_CLOUD_AUTH
Create a Kubernetes secret
This command creates a secret in the Kubernetes system level namespace (kube-system) based on the files you just edited:
kubectl create secret generic dynamic-logging \
  --from-file=./ELASTIC_CLOUD_ID \
  --from-file=./ELASTIC_CLOUD_AUTH \
  --namespace=kube-system
Deploy the Beats
Manifest files are provided for each Beat. These manifest files use the secret created earlier to configure the Beats to connect to your Elasticsearch and Kibana servers.
About Filebeat
Filebeat will collect logs from the Kubernetes nodes and the containers running in each pod running on those nodes. Filebeat is deployed as a DaemonSetEnsures a copy of a Pod is running across a set of nodes in a cluster. . Filebeat can autodiscover applications running in your Kubernetes cluster. At startup Filebeat scans existing containers and launches the proper configurations for them, then it will watch for new start/stop events.
Here is the autodiscover configuration that enables Filebeat to locate and parse Redis logs from the Redis containers deployed with the guestbook application. This configuration is in the file filebeat-kubernetes.yaml:
- condition.contains:
    kubernetes.labels.app: redis
  config:
    - module: redis
      log:
        input:
          type: docker
          containers.ids:
            - ${data.kubernetes.container.id}
      slowlog:
        enabled: true
        var.hosts: ["${data.host}:${data.port}"]
This configures Filebeat to apply the Filebeat module redis when a container is detected with a label app containing the string redis. The redis module has the ability to collect the log stream from the container by using the docker input type (reading the file on the Kubernetes node associated with the STDOUT stream from this Redis container). Additionally, the module has the ability to collect Redis slowlog entries by connecting to the proper pod host and port, which is provided in the container metadata.
Deploy Filebeat:
kubectl create -f filebeat-kubernetes.yamlVerify
kubectl get pods -n kube-system -l k8s-app=filebeat-dynamicAbout Metricbeat
Metricbeat autodiscover is configured in the same way as Filebeat. Here is the Metricbeat autodiscover configuration for the Redis containers. This configuration is in the file metricbeat-kubernetes.yaml:
- condition.equals:
    kubernetes.labels.tier: backend
  config:
    - module: redis
      metricsets: ["info", "keyspace"]
      period: 10s

      # Redis hosts
      hosts: ["${data.host}:${data.port}"]
This configures Metricbeat to apply the Metricbeat module redis when a container is detected with a label tier equal to the string backend. The redis module has the ability to collect the info and keyspace metrics from the container by connecting to the proper pod host and port, which is provided in the container metadata.
Deploy Metricbeat
kubectl create -f metricbeat-kubernetes.yamlVerify
kubectl get pods -n kube-system -l k8s-app=metricbeatAbout Packetbeat
Packetbeat configuration is different than Filebeat and Metricbeat. Rather than specify patterns to match against container labels the configuration is based on the protocols and port numbers involved. Shown below is a subset of the port numbers.
Note: If you are running a service on a non-standard port add that port number to the appropriate type infilebeat.yamland delete / create the Packetbeat DaemonSet.
packetbeat.interfaces.device: any

packetbeat.protocols:
- type: dns
  ports: [53]
  include_authorities: true
  include_additionals: true

- type: http
  ports: [80, 8000, 8080, 9200]

- type: mysql
  ports: [3306]

- type: redis
  ports: [6379]

packetbeat.flows:
  timeout: 30s
  period: 10s
Deploy Packetbeat
kubectl create -f packetbeat-kubernetes.yamlVerify
kubectl get pods -n kube-system -l k8s-app=packetbeat-dynamicView in Kibana
Open Kibana in your browser and then open the Dashboard application. In the search bar type Kubernetes and click on the Metricbeat dashboard for Kubernetes. This dashboard reports on the state of your Nodes, deployments, etc.
Search for Packetbeat on the Dashboard page, and view the Packetbeat overview.
Similarly, view dashboards for Apache and Redis. You will see dashboards for logs and metrics for each. The Apache Metricbeat dashboard will be blank. Look at the Apache Filebeat dashboard and scroll to the bottom to view the Apache error logs. This will tell you why there are no metrics available for Apache.
To enable Metricbeat to retrieve the Apache metrics, enable server-status by adding a ConfigMap including a mod-status configuration file and re-deploy the guestbook.
Scale your deployments and see new pods being monitored
List the existing deployments:
kubectl get deploymentsThe output:
NAME            READY   UP-TO-DATE   AVAILABLE   AGE
frontend        3/3     3            3           3h27m
redis-master    1/1     1            1           3h27m
redis-slave     2/2     2            2           3h27m
Scale the frontend down to two pods:
kubectl scale --replicas=2 deployment/frontendThe output:
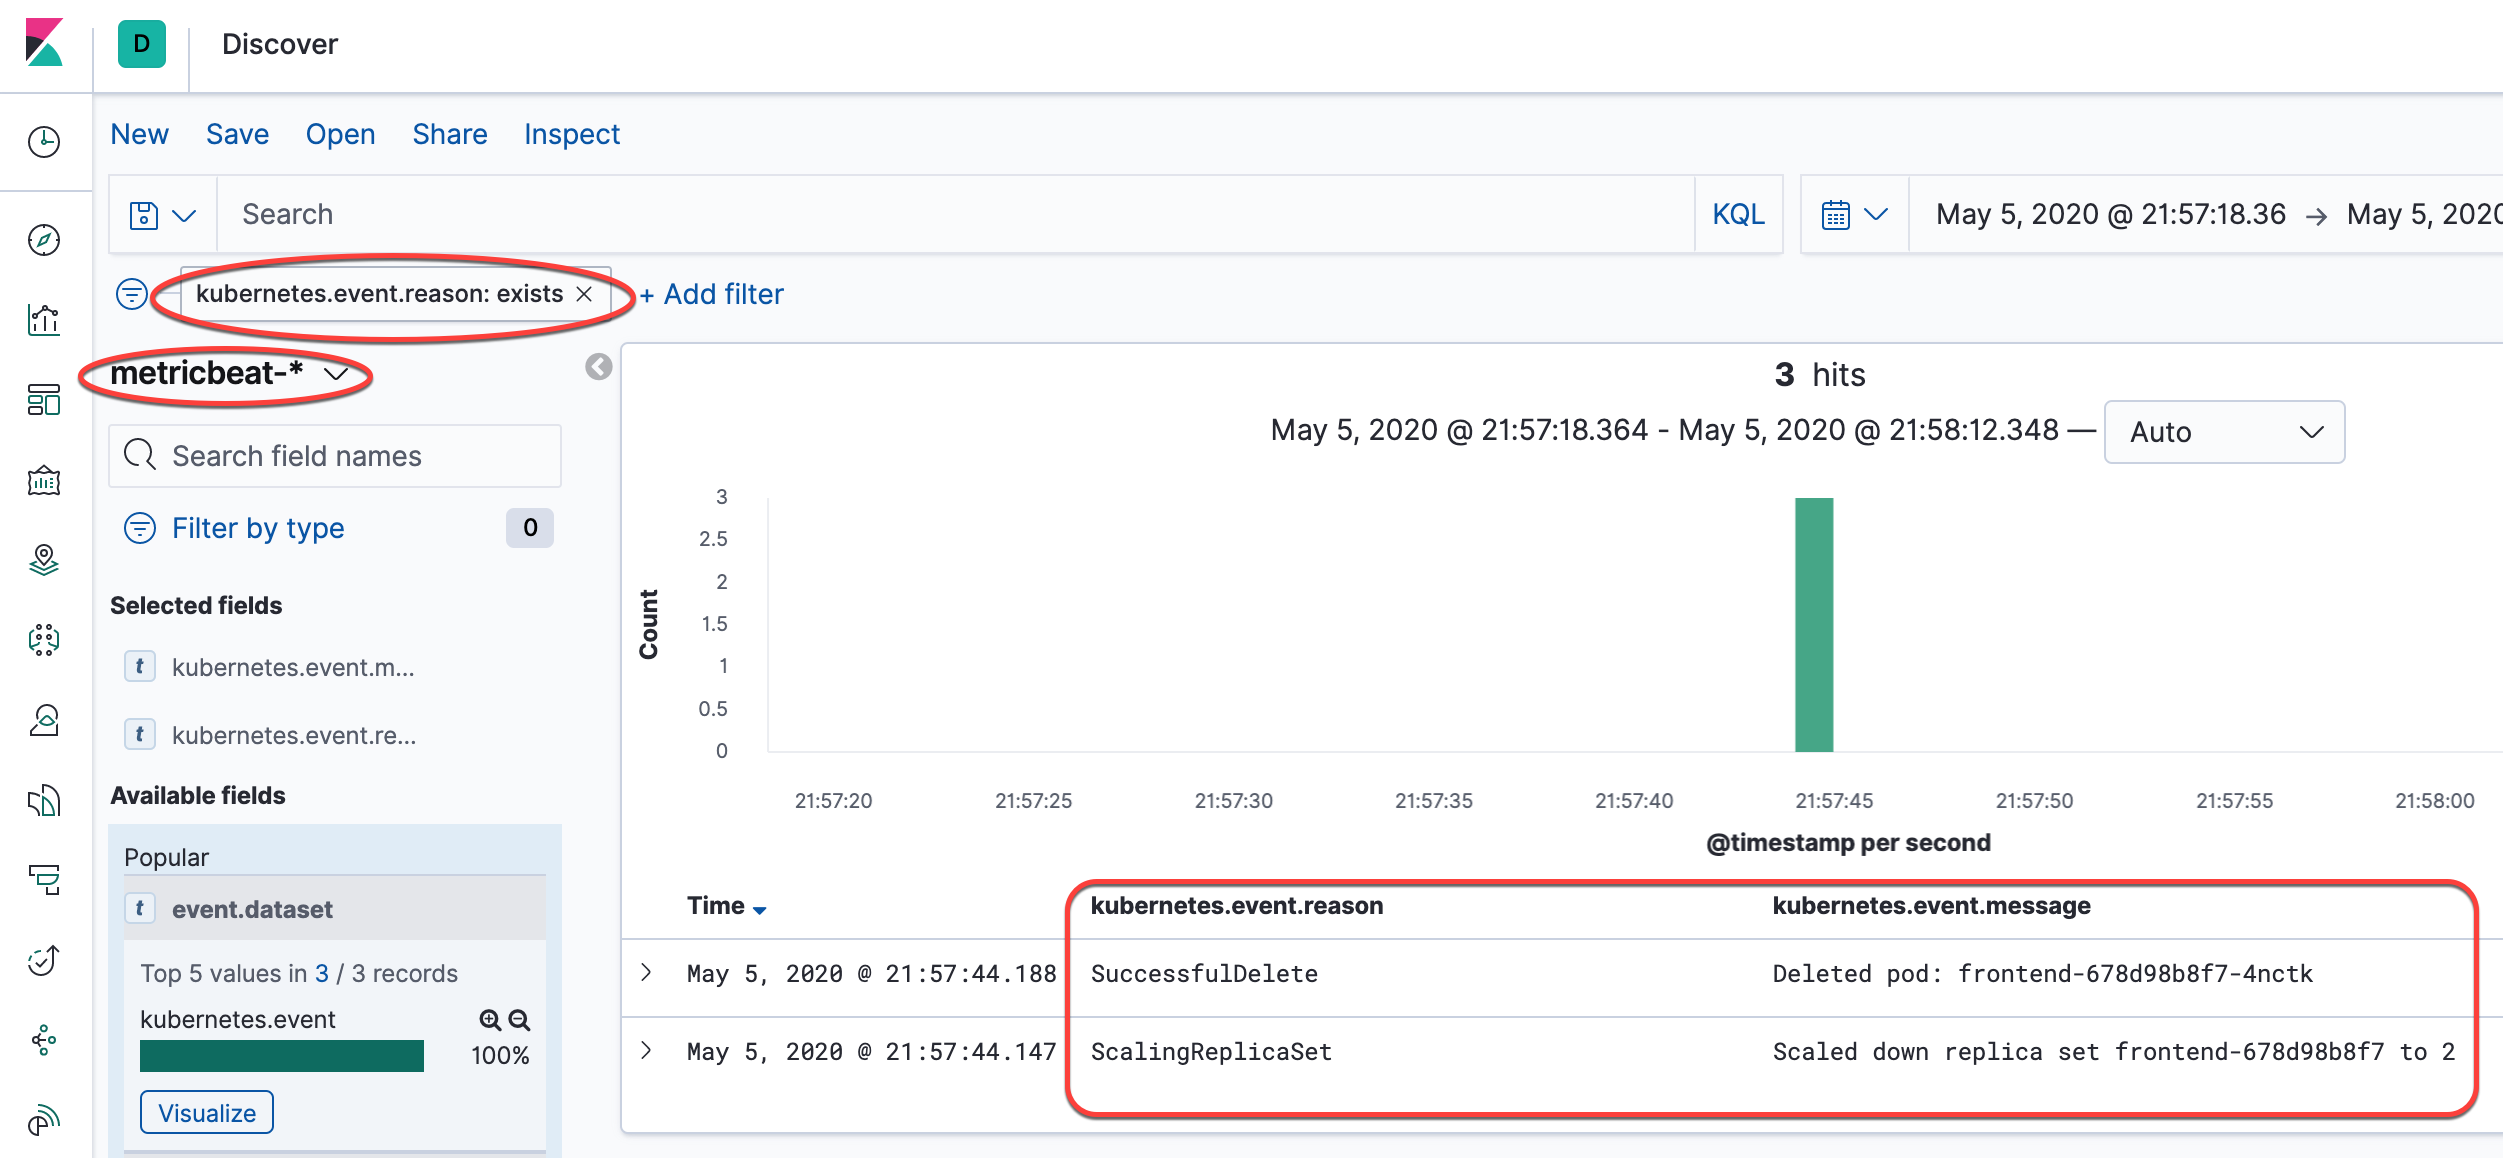
deployment.extensions/frontend scaledView the changes in Kibana
See the screenshot, add the indicated filters and then add the columns to the view. You can see the ScalingReplicaSet entry that is marked, following from there to the top of the list of events shows the image being pulled, the volumes mounted, the pod starting, etc.
Cleaning up
Deleting the Deployments and Services also deletes any running Pods. Use labels to delete multiple resources with one command.
Run the following commands to delete all Pods, Deployments, and Services.
  kubectl delete deployment -l app=redis
  kubectl delete service -l app=redis
  kubectl delete deployment -l app=guestbook
  kubectl delete service -l app=guestbook
  kubectl delete -f filebeat-kubernetes.yaml
  kubectl delete -f metricbeat-kubernetes.yaml
  kubectl delete -f packetbeat-kubernetes.yaml
  kubectl delete secret dynamic-logging -n kube-system
Query the list of Pods to verify that no Pods are running:
kubectl get podsThe response should be this:
No resources found.
What's next
- Learn about tools for monitoring resources
- Read more about logging architecture
- Read more about application introspection and debugging
- Read more about troubleshoot applications
Feedback
Was this page helpful?
Thanks for the feedback. If you have a specific, answerable question about how to use Kubernetes, ask it on Stack Overflow. Open an issue in the GitHub repo if you want to report a problem or suggest an improvement.
Page last modified on November 18, 2019 at 6:55 AM PST by
[docs/tutorials]: update kube-state-metrics install details (#17570) (Page History)