Abstract
Starting in 2018, a new data center in Singapore provided people in East, Southeast, and South Asia with significantly faster access to Wikipedia and other Wikimedia sites. Using a Bayesian synthetic control method, I estimate that the region routed to this new data center experienced a 6.3% increase in unique devices accessing Wikipedia each month, with high confidence that a positive effect exists (posterior probability ~97%).
Introduction
One of many investments the Wikimedia movement can make with its limited resources is to expand its network of servers to new regions, so that readers there can access Wikipedia and other Wikimedia projects more quickly. The Wikimedia Foundation’s 2023-24 annual plan includes just such an expansion: a new South America data center in South America, expected to open soon in São Paulo.
The new data center (DC) will certainly increase the speed of access for nearby users, saving them time and annoyance. However, the justification for this project goes further: it is also expected that the speed increase will in turn make users visit more frequently and stay longer, increasing Wikimedia’s “relevance”, as measured by Wikipedia’s monthly unique devices.
A limited amount of prior research on Wikimedia traffic, along with conventional wisdom in the web performance field, suggests that we can expect such an increase. But what size increase? How confidently? This study attempts to answer such questions.
Background
Wikimedia’s content delivery network
The Wikimedia Foundation’s Site Reliability Engineering team maintains a content delivery network to provide fast access to Wikipedia and the other sites it hosts for users around the globe. The network has data centers (DCs) in six different locations:
- Ashburn, Virginia, United States
- Dallas, United States
- San Francisco, United States
- Amsterdam, the Netherlands
- Marseille, France
- Singapore
Users are routed to a DC based on their location, as inferred from their IP address using a commercially-available database. The routing is done at the country level, except for the US and Canada where it is done at the state and province level (since 3 of the 6 DCs are located in the US).
These routing decisions are generally based on libraries of real-world data showing the latency of Internet connections between different locations. That latency depends on several factors including the geographic structure of the global Internet backbone, but, in a universe ruled by the speed of light, the basic, straight-line distance is one of the most important.
Past data center additions
The addition of a new DC provides an excellent opportunity to test our hypothesis about speed increases. We have two examples recent enough to be covered by our current traffic datasets:
- the introduction of the Singapore DC in 2018.
- the introduction of the Marseille DC in 2022.
Singapore, 2018
Before 2018, users in East, Southeast, and South Asia and Oceania were served from either Amsterdam or San Francisco. Adding a DC in that region substantially decreased latency and increased speed for many users, a natural result given that Singapore lies 13,500 km from San Francisco and 10,500 km from Amsterdam.
However, as with any DC, the users that were switched had a range of different experiences. For example, although Australia and New Zealand were switched from the San Francisco DC to the Singapore DC, cutting the distance in half, the actual decrease in latency was “questionable”.
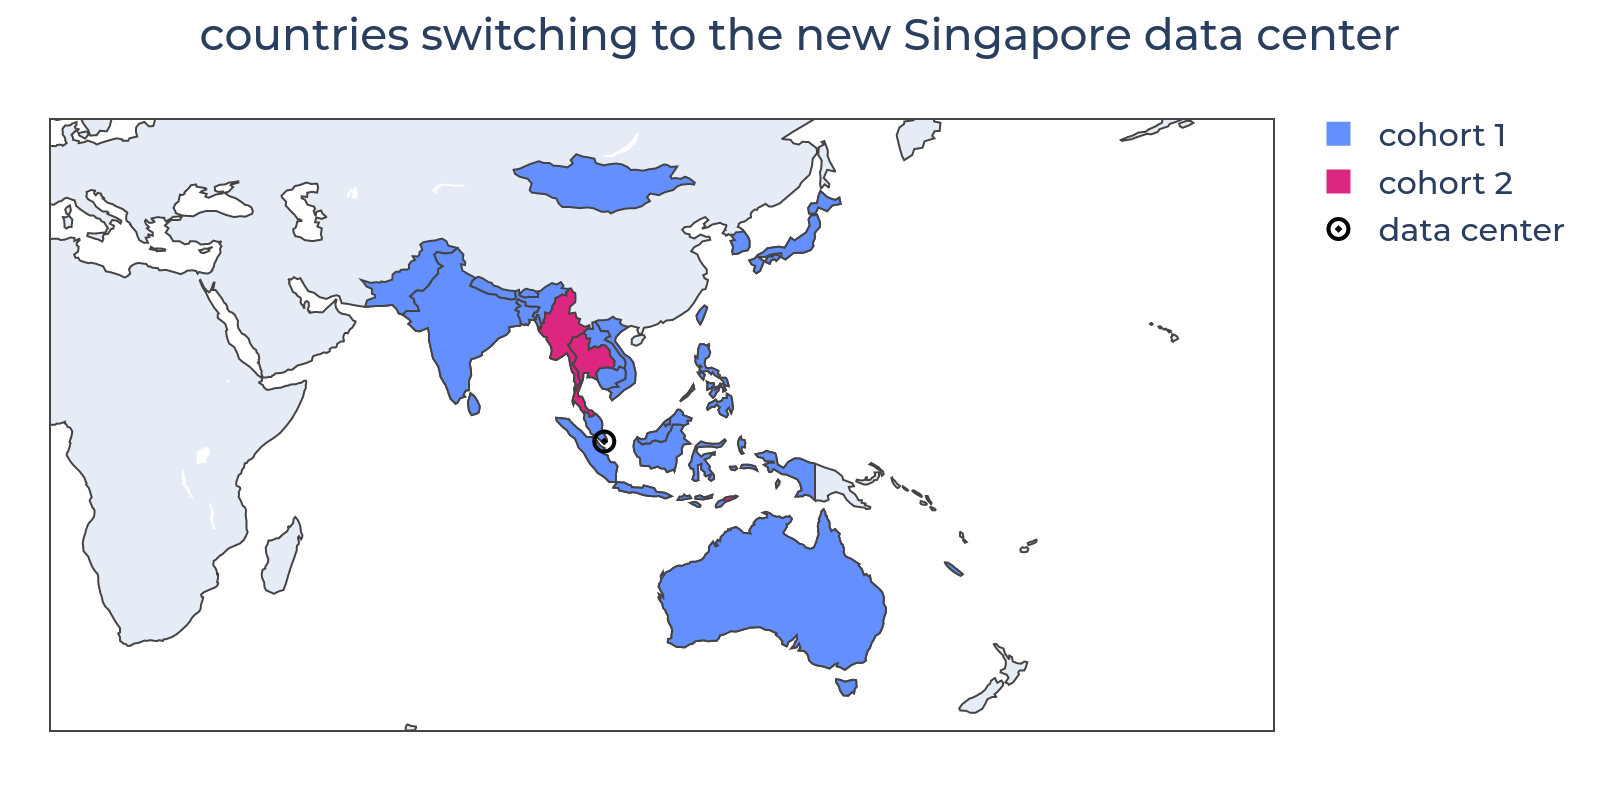
In total, 38 countries (the “Singapore countries”) were switched to the Singapore DC, in two distinct cohorts.

Figure 1:The location of the Singapore DC added in 2017 and the countries which were switched to use it.
Table 1:Statistics on the two cohorts of countries switched to use the Singapore DC
| number of countries | first switch date | last switch date | yearly page views | |
|---|---|---|---|---|
| cohort 1 | 33 | 2018-03-22 | 2018-04-05 | 39.3 B |
| cohort 2 | 5 | 2018-07-19 | 2018-07-19 | 1.13 B |
Marseille, 2022
The Marseille DC opened in 2022 is a different case. Although Marseille is a well-connected node in the fiber optic network, it is only 1,000 km from the preexisting Amsterdam DC.
In fact, the primary benefit of this new DC is redundancy for the Amsterdam DC, which previously served nearly half of Wikipedia traffic.
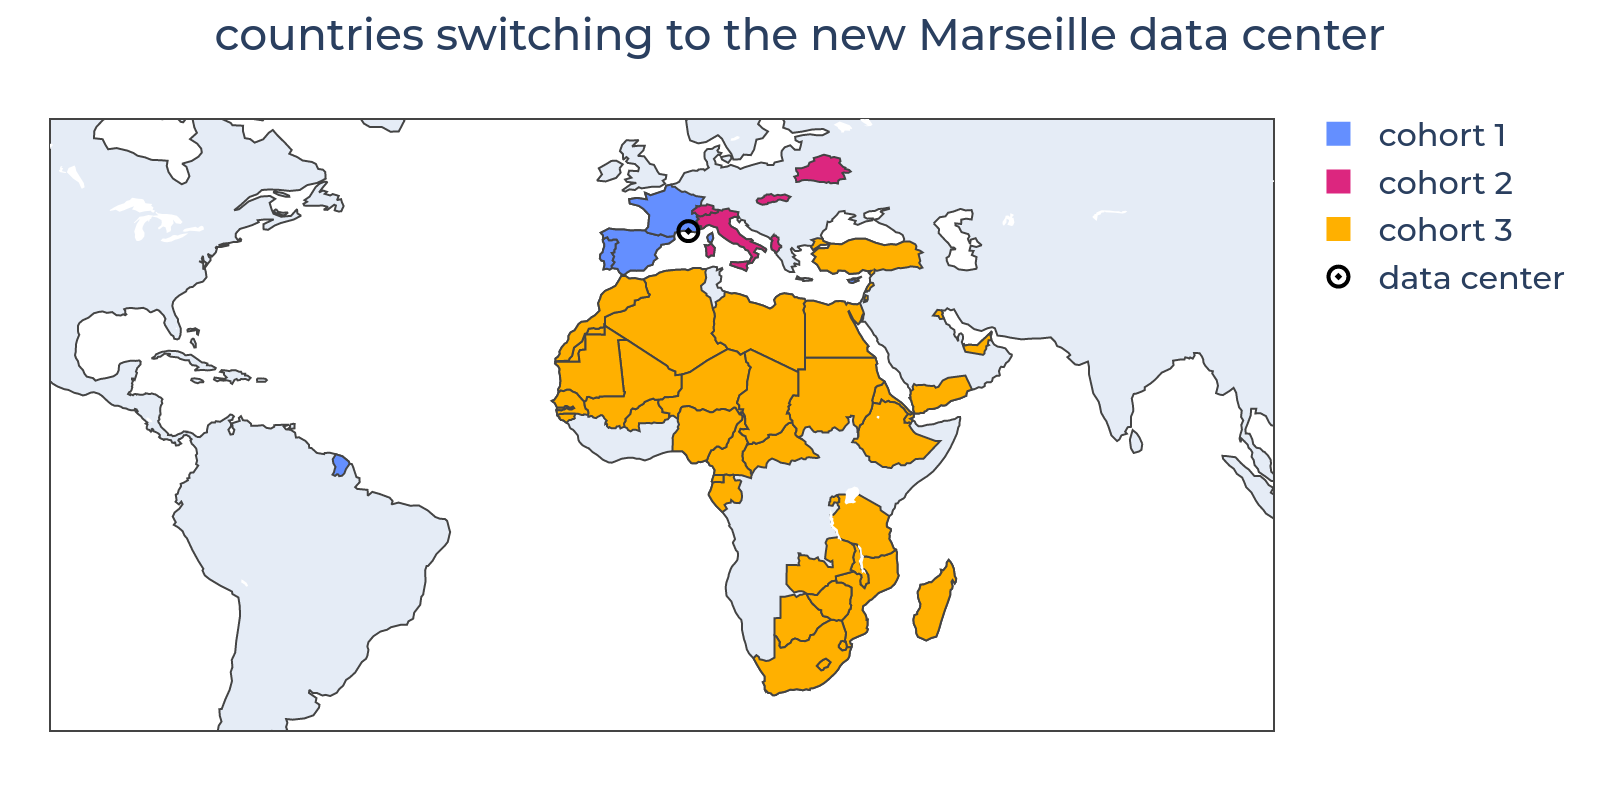
In total, 55 countries were switched to the Marseille DC, in three distinct cohorts.

Figure 2:The location of the Marseille DC added in 2022 and the countries which were switched to use it.
Table 2:Statistics on the three cohorts of countries switched to use the Marseille DC
| number of countries | first switch date | last switch date | yearly page views | |
|---|---|---|---|---|
| cohort 1 | 4 | 2022-03-17 | 2022-03-23 | 11.1 B |
| cohort 2 | 9 | 2022-06-28 | 2022-06-28 | 8.38 B |
| cohort 3 | 42 | 2022-08-04 | 2022-08-12 | 6.51 B |
Prior research
In May 2018, after the Singapore cohort 1 switches, Megan Neisler reviewed traffic data from the switched countries and noted suggestive increases in daily mobile page views and mobile unique devices. However, the timing of the increases was not close enough and the scale of the increases not large enough to definitely link them to the new DC.
In May 2019, Miriam Redi compared data on unique devices, page views, and overall internet users in the Singapore countries (with the internet user data coming from the International Telecommunications Union’s yearly statistics). She found “significant and sustained” increases in unique devices (but not page views) after the switch, well above the trend in internet users. This pattern was not found in unaffected countries in Europe, South America, or Africa. However, she did not estimate the size of the increase.
Choice of outcome metric
In Wikimedia, the main metrics for user traffic are page views and unique devices. Following the lead of the Wikimedia Foundation’s current annual plan, this study focuses on unique devices.
Intuitively, one might see focusing on unique devices as a particularly demanding test, expecting a speed increase to have a greater effect on page views than unique devices. After all, page views can be increased by influencing users already on the site (and therefore already counted as unique devices) to immediately view extra pages. In contrast, increasing monthly unique devices requires making infrequent users more likely to visit again after weeks or months or making non-users more likely to visit (through, say, higher search-engine ranking).
However, this intuition should be treated skeptically without solid data to confirm it.
Unique devices data
Unique devices data is actually a family of four different datasets, resulting from two parameter choices:
- scope: project-family or domain
- time grain: daily or monthly
Project-family scope groups together all access to a single project family, like Wikipedia or Wikisource, even when the family is divided into language-specific projects (like the English, Japanese, and Hindi Wikipedias). Domain scope groups together only access to a single domain name; all Wikimedia projects have separate domains for their mobile and main sites, so, for example, en.wikipedia.org and en.m.wikipedia.org are separated.
Unique device data for the Wikipedia project family is by far the most common choice for an overall measure of users of Wikimedia projects. There is no all-project-family scope due to the fact that cookies cannot be shared between different eTLD+1s like “wikipedia.org” and “wikimedia.org”.
Monthly data is almost exclusively the choice for high-level metrics, making it a necessary choice for projects such as this one. It cannot be assumed that an increase in daily unique devices implies a similar increase in monthly unique devices.
In addition, all unique device metrics are subdivided into the “underestimate” (devices making a first request in the time period with at least some Wikimedia cookies) and the “offset” (devices making a request with no Wikimedia cookies, which might be a human first request or a bot request which was not filtered out by one of several different heuristics). The overall estimate composed of the sum of these two components is almost always used.
Methods
Focus on Singapore
This study focuses only on the impact of the Singapore DC. I chose not to include the Marseille DC in the full-scale analysis for two reasons.
First, since the Marseille DC was primarily designed to provide redundancy for the Amsterdam DC, it likely had a relatively small impact on speed, making it a poor test of the hypothesis that speed increases lead to readership increases.
Second, its opening in 2022 happened to come around the time of three major sources of interference in our unique device data:
- the gradual disappearance of the significant traffic increase caused by the covid-19 pandemic
- the 2021-22 traffic data loss, which caused an artificial decrease in traffic statistics for countries served by US DCs. Although none of the Marseille countries are in this category, many of the countries we might have used as controls are.
- the 2021-22 unique devices by project family overcount.
No such effects are known around the opening of the Singapore DC in 2017.
Synthetic control
The main analysis uses the CausalImpact package to construct a Bayesian structural time series model for the outcome variable (monthly unique devices in the Singapore countries) before the intervention (the switch to the new DC) occurred. CausalImpact selects and weights predictor variables from among the candidates (monthly unique devices in each of the six Wikimedia regions where no countries switched to the Singapore DC) to create the most predictive model, using a spike-and-slab prior to avoid overfitting.
The model’s predictions for the outcome after the intervention are then used as a synthetic control for the actual outcome after the intervention. If the actual outcome differs sufficiently from the synthetic control, we find that the difference was the impact of the intervention. CausalImpact provides a posterior probability that the impact exists.
Wikipedia unique devices (i.e. project-family scope) would be the natural choice here, but unfortunately, our project-family data starts in April 2017. This gives only 12 months of data before the cohort 1 countries switched, too little for a reliable model (particularly given the significance of yearly seasonality).
However, our domain-level data starts in January 2016, which gives a more-feasible 27 months of pre-switch data. As a result, for each country, I used unique devices for its highest-traffic wiki (e.g. English Wikipedia for India, Chinese Wikipedia for Taiwan), combining the data for the wiki’s mobile and main domains. Combining mobile and main domains is permissible, since a particular device is generally always routed to one or the other. However, it would be misleading to combine domains of different projects, since many devices visit more than one project.
From this data, I used only the underestimate component, since it excludes most bots and produces less noisy data. Although we are ultimately interested in the impact on total unique devices, it is reasonable to assume the relative impact of the new DC is the same on both the underestimate and the offset.
In the model runs, I specified yearly seasonality and looked at the model results for one year after the intervention (as with any model, the synthetic control becomes less reliable as it moves farther from its training data).
Assumptions
This method has two key assumptions:
- that the predictors are not affected by the intervention (i.e., that users in the six non-switched regions were not affected by the Singapore DC). We can confidently make this assumption, since we control how users are routed to DCs. This routing is not perfect because of the limitations of IP geolocation, but is still highly accurate at the country level. In addition, the same geolocation database is used for both routing users to DCs and for recording their traffic data, so a country’s unique device data should always correspond to users who received that country’s routing even when some of those users were actually in a different country.
- that the relationship between the predictors and the outcomes (i.e. the correlations between unique devices in the Singapore countries and in the non-switched regions) remains stable, other than the intervention, during the chosen period. This is a reasonable assumption, but not certain. See the “Limitations and future work” section for more discussion.
Results
I modeled the two cohorts of switching countries separately, since the intervention occurred at different times for each.
Cohort 1
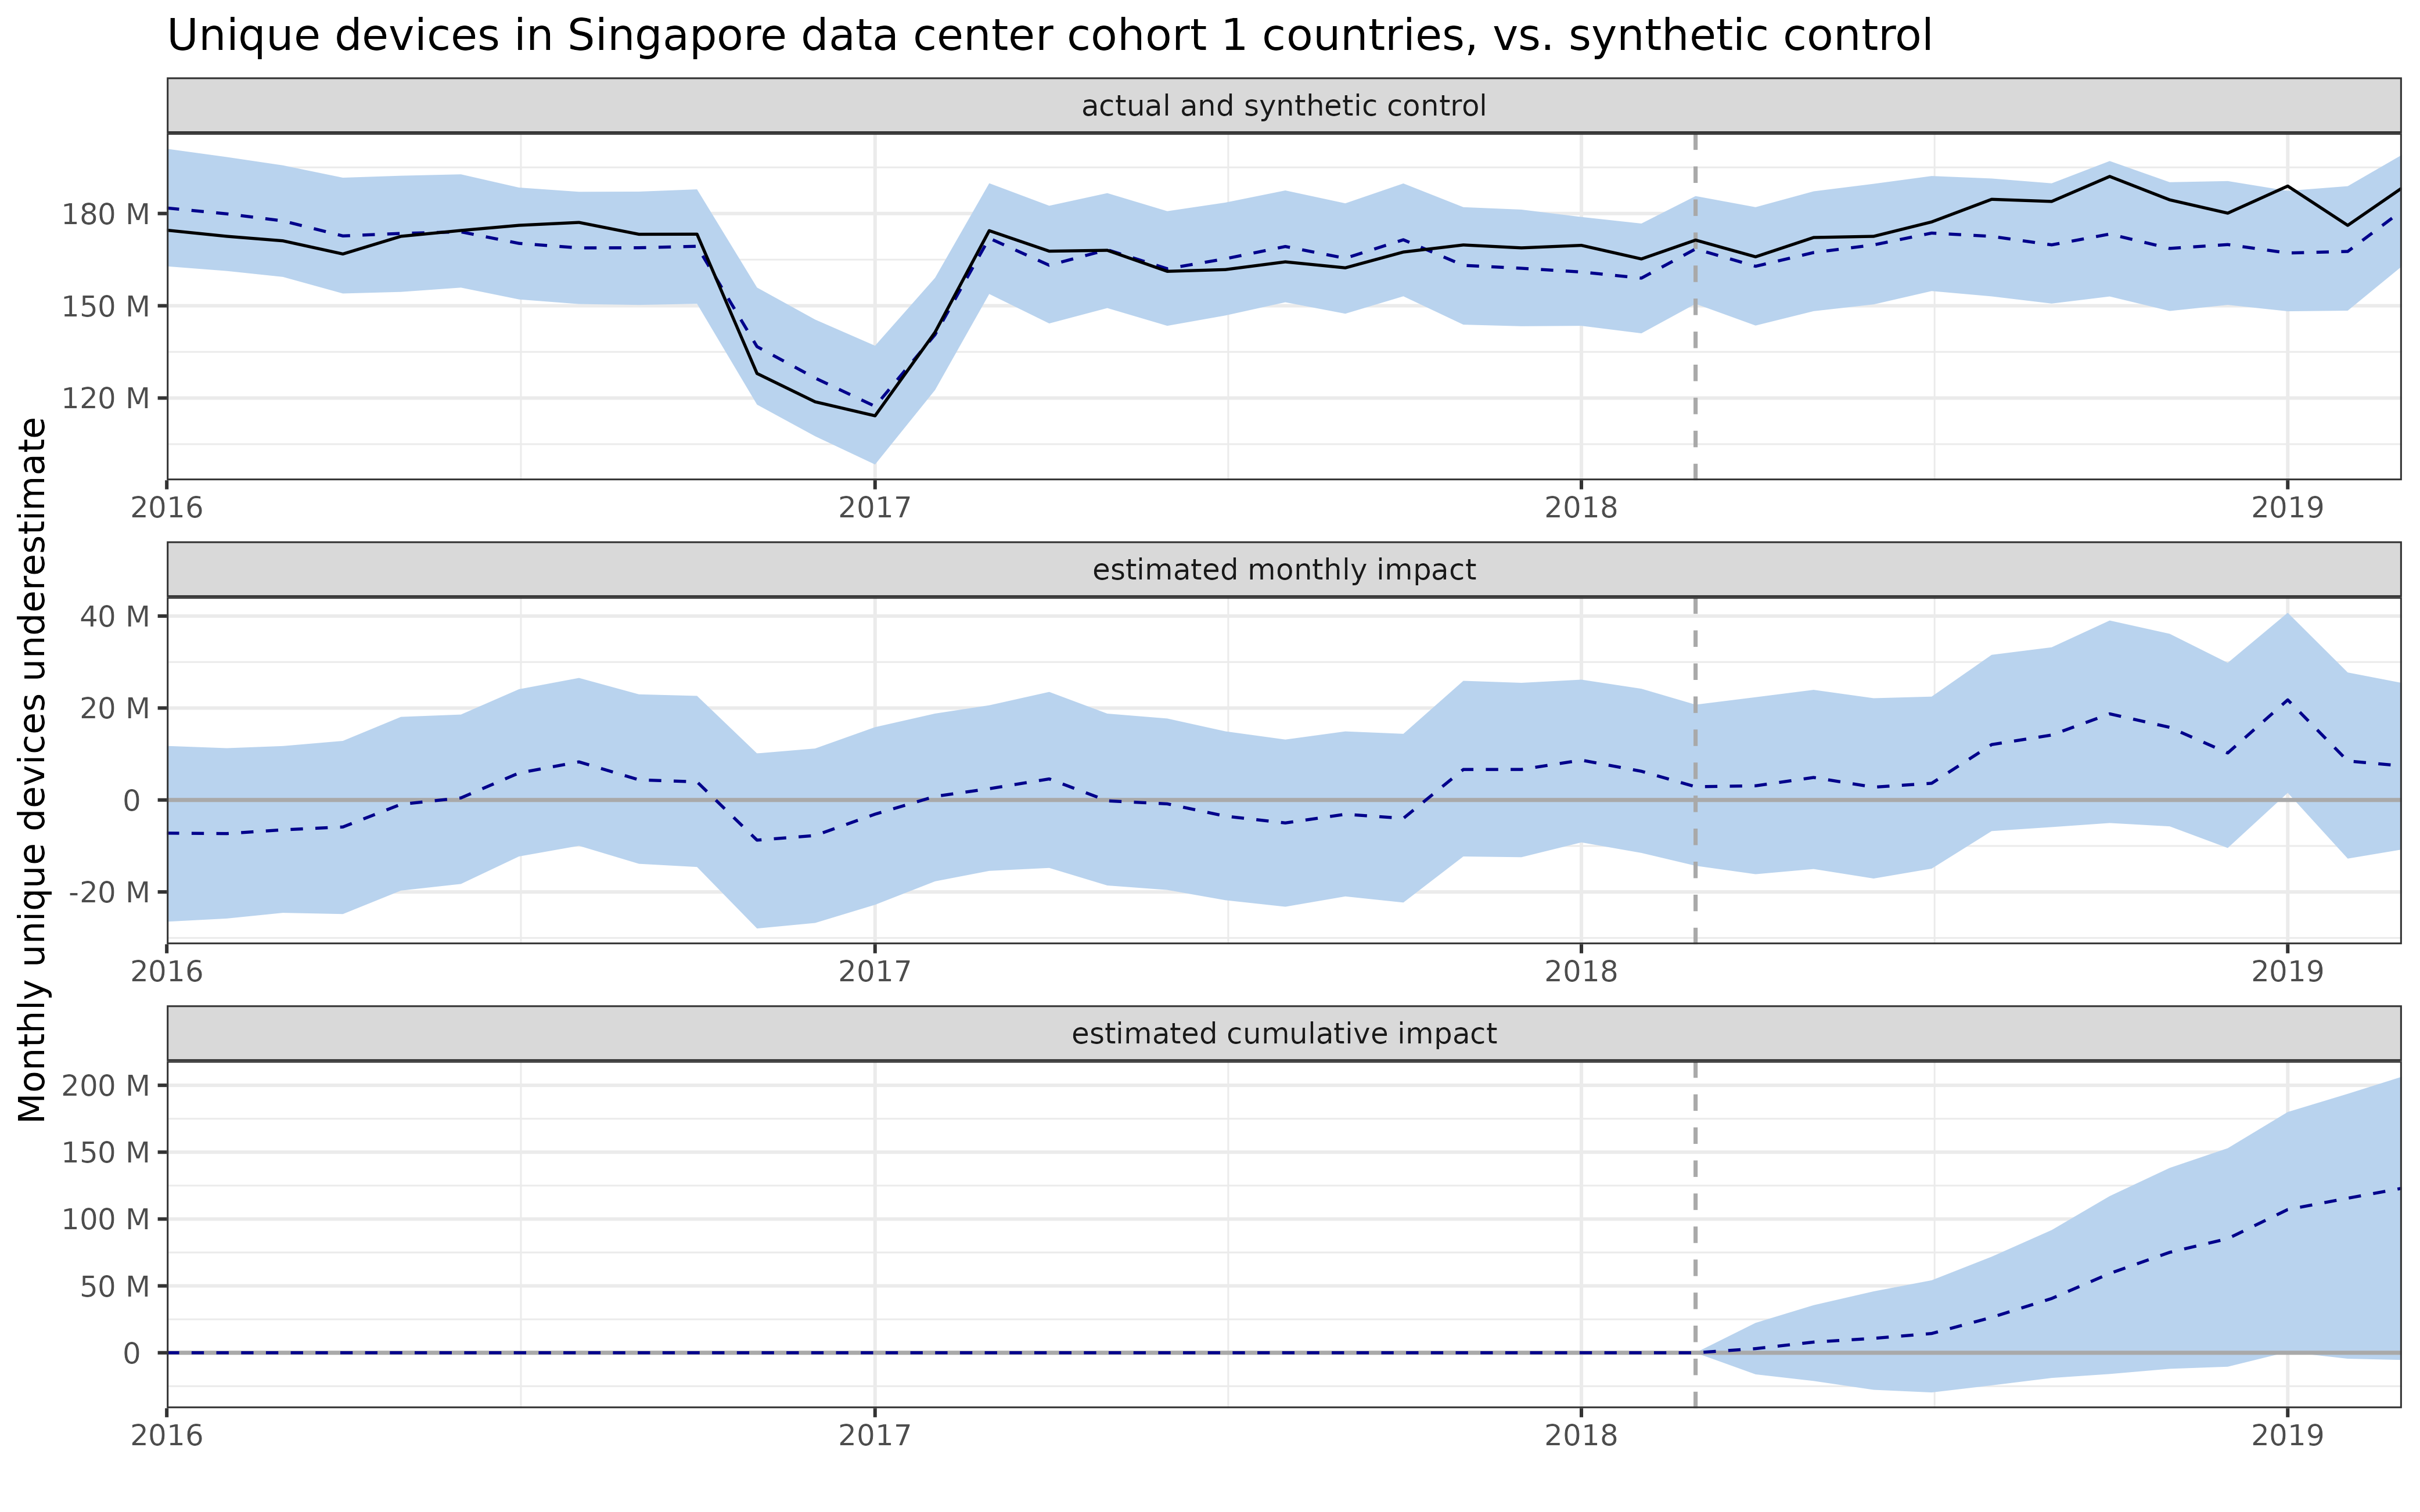
Among cohort 1 countries, the average monthly effect during the year after the switch is a 6.1% increase (SD 2.6 pp). In absolute terms, this is an increase of 10 million unique devices (SD 4.3 million), though note this is calculated based on the underestimate only.
The posterior probability that the new DC increased unique devices is 97.1%.

Figure 3:A CausalImpact plot showing the estimated impact of switching to Singapore on unique devices among cohort 1 countries
Posterior inference {CausalImpact}

                         Average              Cumulative
Actual                   1.8e+08              2.2e+09
Prediction (s.d.)        1.7e+08 (4.3e+06)    2.0e+09 (5.2e+07)
95% CI                   [1.6e+08, 1.8e+08]   [2.0e+09, 2.2e+09]

Absolute effect (s.d.)   1.0e+07 (4.3e+06)    1.2e+08 (5.2e+07)
95% CI                   [-450141, 1.7e+07]   [-5401694, 2.1e+08]

Relative effect (s.d.)   6.1% (2.6%)          6.1% (2.6%)
95% CI                   [-0.25%, 11%]        [-0.25%, 11%]

Posterior tail-area probability p:   0.02888
Posterior prob. of a causal effect:  97.112%

For more details, type: summary(impact, "report")
Program 1:Numerical summary of the CausalImpact results for Singapore cohort 1 countries
Cohort 2
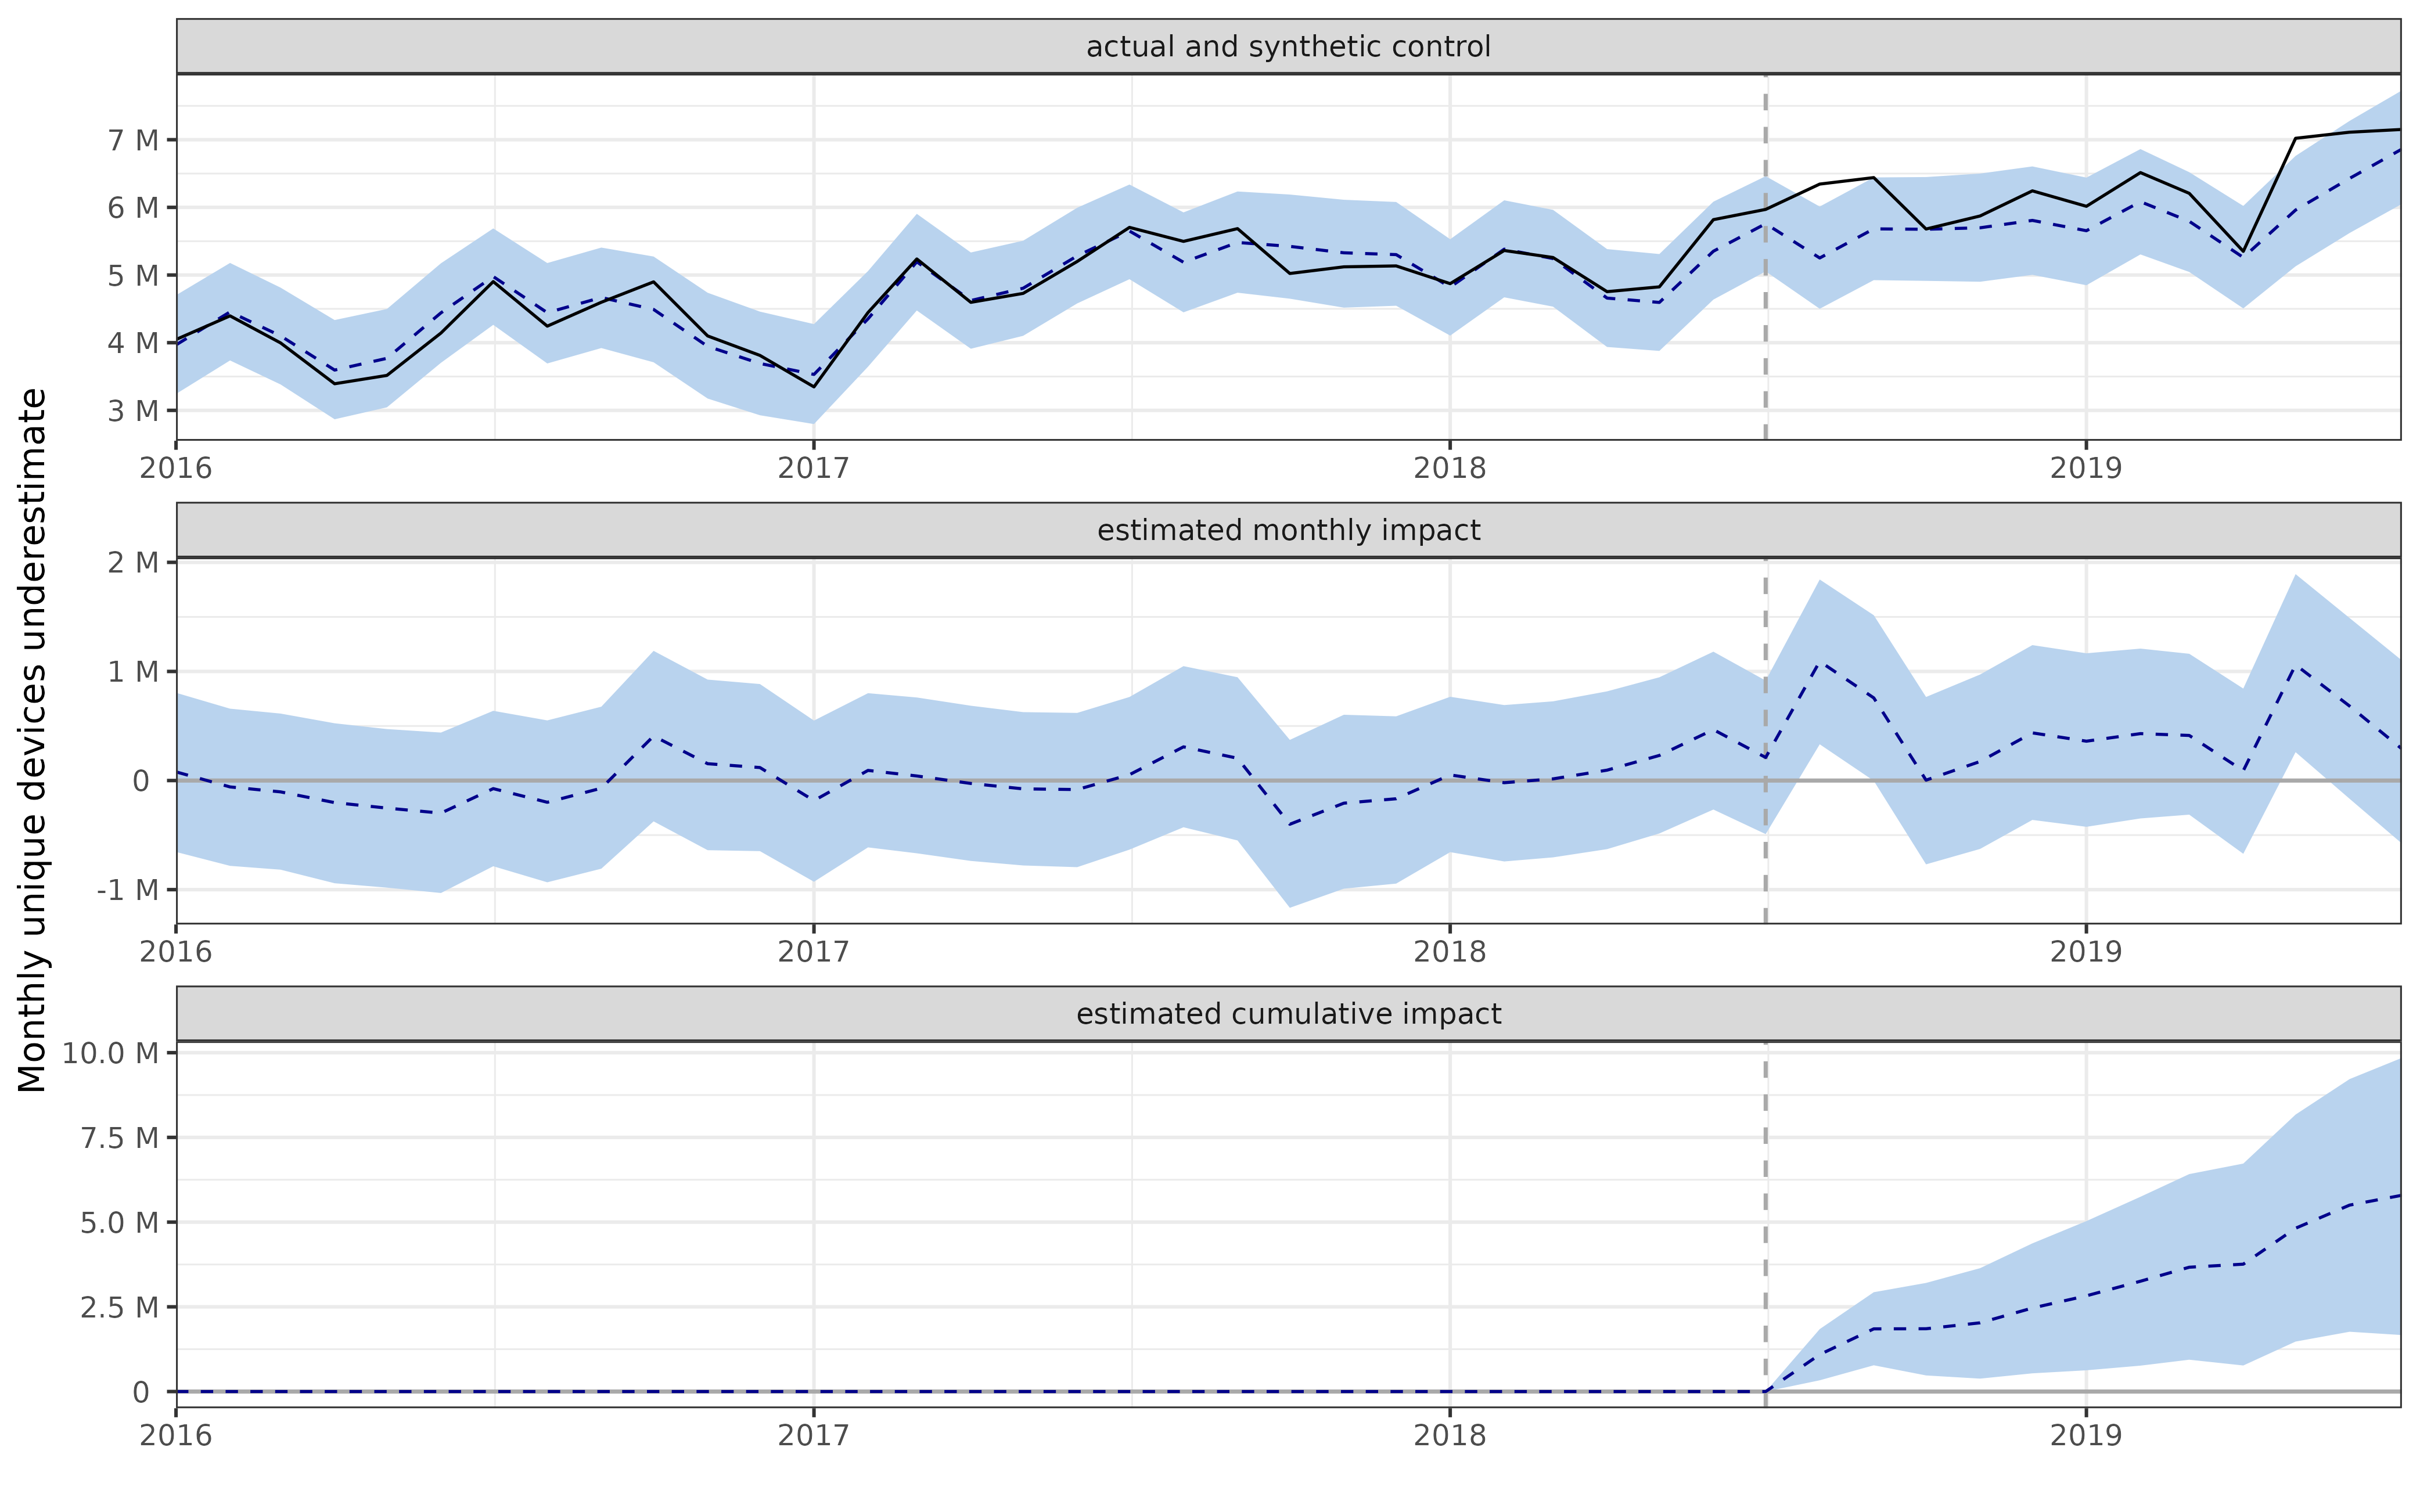
Among cohort 2 countries, the average monthly effect during the year after the switch is an 8.3% increase (SD 3.2 pp). In absolute terms, this is an increase of 500,000 unique devices (SD 170,000), again in the underestimate only.
The posterior probability that the new DC increased unique devices is 99.7%.

Figure 4:A CausalImpact plot showing the estimated impact of switching to Singapore on unique devices among cohort 2 countries
Posterior inference {CausalImpact}

                         Average              Cumulative
Actual                   6.3e+06              7.6e+07
Prediction (s.d.)        5.8e+06 (172063)     7.0e+07 (2064751)
95% CI                   [5.5e+06, 6.2e+06]   [6.6e+07, 7.4e+07]

Absolute effect (s.d.)   482648 (172063)      5791779 (2064751)
95% CI                   [138915, 820573]     [1666975, 9846874]

Relative effect (s.d.)   8.3% (3.2%)          8.3% (3.2%)
95% CI                   [2.2%, 15%]          [2.2%, 15%]

Posterior tail-area probability p:   0.003
Posterior prob. of a causal effect:  99.6999%

For more details, type: summary(impact, "report")
Program 2:Numerical summary of the CausalImpact results for Singapore cohort 2 countries
Combined effect
Combining the average effects from the two cohorts in proportion to their size, the total impact is 6.2% (virtually identical to the cohort 1 effect, since cohort 1 includes about 30 times as many unique devices as cohort 2).
Applied to the key metric of monthly Wikipedia unique devices, this 6.2% increase translates into an extra 21.0 M unique devices, representing a 1.4% increase in the global number.
Conclusion
This analysis offers strong evidence that the Singapore DC increased unique devices in the countries that switched to use it, although we cannot be quite as confident in the size of that increase. Notably, even though the two cohorts represented independent tests of the hypothesis, both showed similar, substantial increases. In addition, this result agrees with the positive indications from the prior research.
Estimated impact of the São Paulo data center
Given these results, what can we expect from the planned São Paulo DC?
Countries will be routed to the new DC if real-world measures show it offers them lower latency than their current DC (currently the Dallas DC for all of Latin America and the Caribbean). However, geographic distance offers a reasonable proxy for this.
All of Central America and the large majority of the Caribbean’s population lie closer to Dallas. In addition, all of Colombia and Venezuela’s major cities are slightly closer to Dallas (Bogotá, for example, is about 3,900 km from Dallas but about 4,300 km from São Paulo).
Therefore, a sensible assumption is that all South America except Colombia and Venezuela is routed to the São Paulo DC. Assuming this area experiences the same overall impact as the Singapore countries, it would see an increase of 5.1 M monthly Wikipedia unique devices, which would be a 0.3% increase in the global total.
Note that this is not based on the assumption that all the switched countries experience a major increase in speed after the switch. The calculated impact is based on the overall impact in all the Singapore countries, including some which may have seen little or no benefit from the switch.
Limitations and future work
Randomized trial
The synthetic control method depends on the assumption that the relationship between unique devices in Singapore countries and unique devices in the control regions stays substantially the same between the pre-intervention and post-intervention periods. Although this is probably true, there are plausible situations that would invalidate it, like a change to Google’s algorithm that dramatically affected its ranking of Wikipedia content in, say, South and Southeast Asia but not Europe or Africa.
The best option to address this limitation would be a randomized controlled trial, where our units of analysis (whether individual users or country provinces) would be randomly assigned to connect to a closer DC or not. That way, we would know that no extraneous effect would follow the same pattern.
The upcoming introduction of the São Paulo DC provides a golden opportunity to run such a randomized trial.
Describing the page speed—unique devices relationship
This analysis provides strong evidence that increases in page speed cause increases in unique devices, but does not provide insight into the shape of the relationship. For instance, if we reduce average loading time in a region from 2 s to 1.8 s, how much are unique devices likely to increase? What if we reduce it down to 1.5 s?
Further analyses should work to define this relationship by looking at the size of the speed-up, rather than just whether a speed-up existed (as shown by the decision to switch the region to the new DC) and by looking at many speed-ups of different sizes rather than a single one (say, by studying individual countries rather than all the affected countries as a unit).
Effects on page views
Redi’s 2019 analysis suggested that the Singapore DC increased unique devices (which this analysis has confirmed), but not page views. This seems strange: why would a speed-up significant enough to increase the number of users not also increase the total number of pages they viewed?
Further research should assess the impact on page views and, if there is indeed none, try to resolve this paradox.
Source code
The source code for this analysis and report is available at gitlab
Credits
The banner image is by Victor Grigas and used under CC-BY-SA 3.0.
Acknowledgments
Many thanks to Morten Warncke-Wang and Sukhbir Singh for reviewing a draft of this report and providing thoughtful suggestions, and to Mikhail Popov and Omari Sefu for their caring and capable mentorship.
Thank you to Andrea Rico and, of course, Himanshi Shah-Quinn for listening to me talk about this project and for taking my ambitions seriously even when they are fuzzy.